
by Charles Rudelitch, Executive Director, Sunrise County Economic Council
So far this year, the number of border crossings from Canada through Calais appear to have stabilized with year-over-year increases since March. The border crossing entry data from the U.S. Department of Transportation show that just over 61,000 people crossed into Calais from New Brunswick in May. This represents a 23% increase over May 2025, although still over 20% less than the 79,000 who crossed into Calais in May 2024. The number of trucks crossing into Calais showed a stronger rebound, with just over 4,700 in May 2026 representing a 17% gain over the 4,064 that entered in May 2025. Just under 4,700 trucks entered into Calais in May 2024.
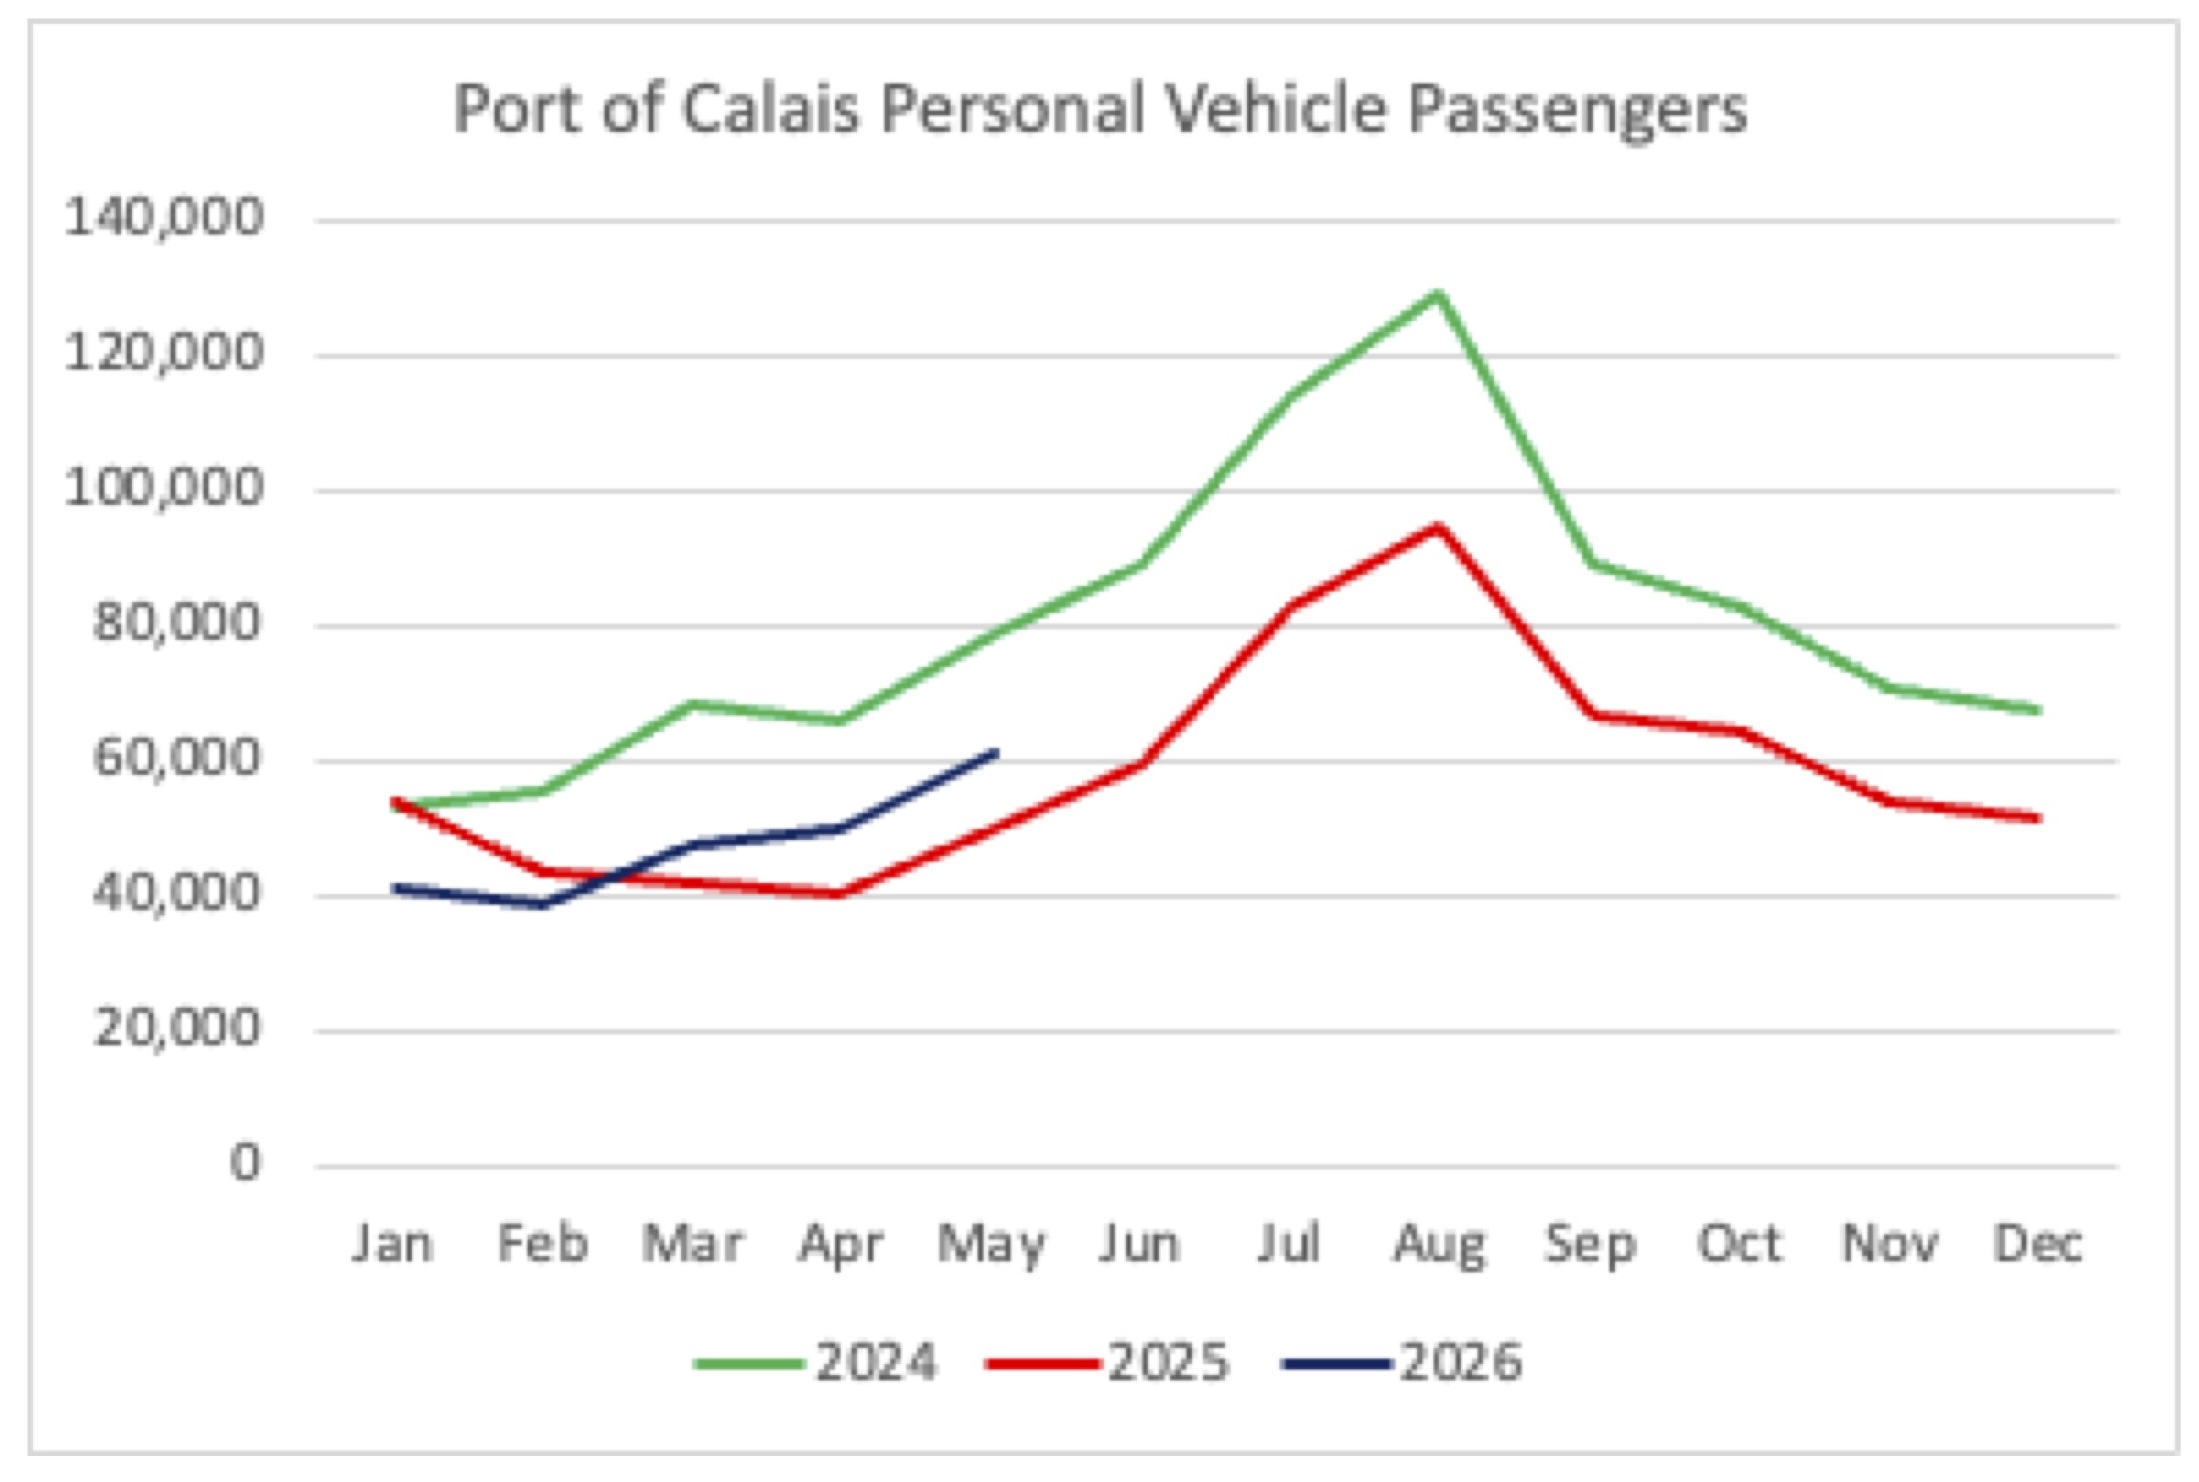
Port of Calais Personal Vehicle Passengers (2024-2026)
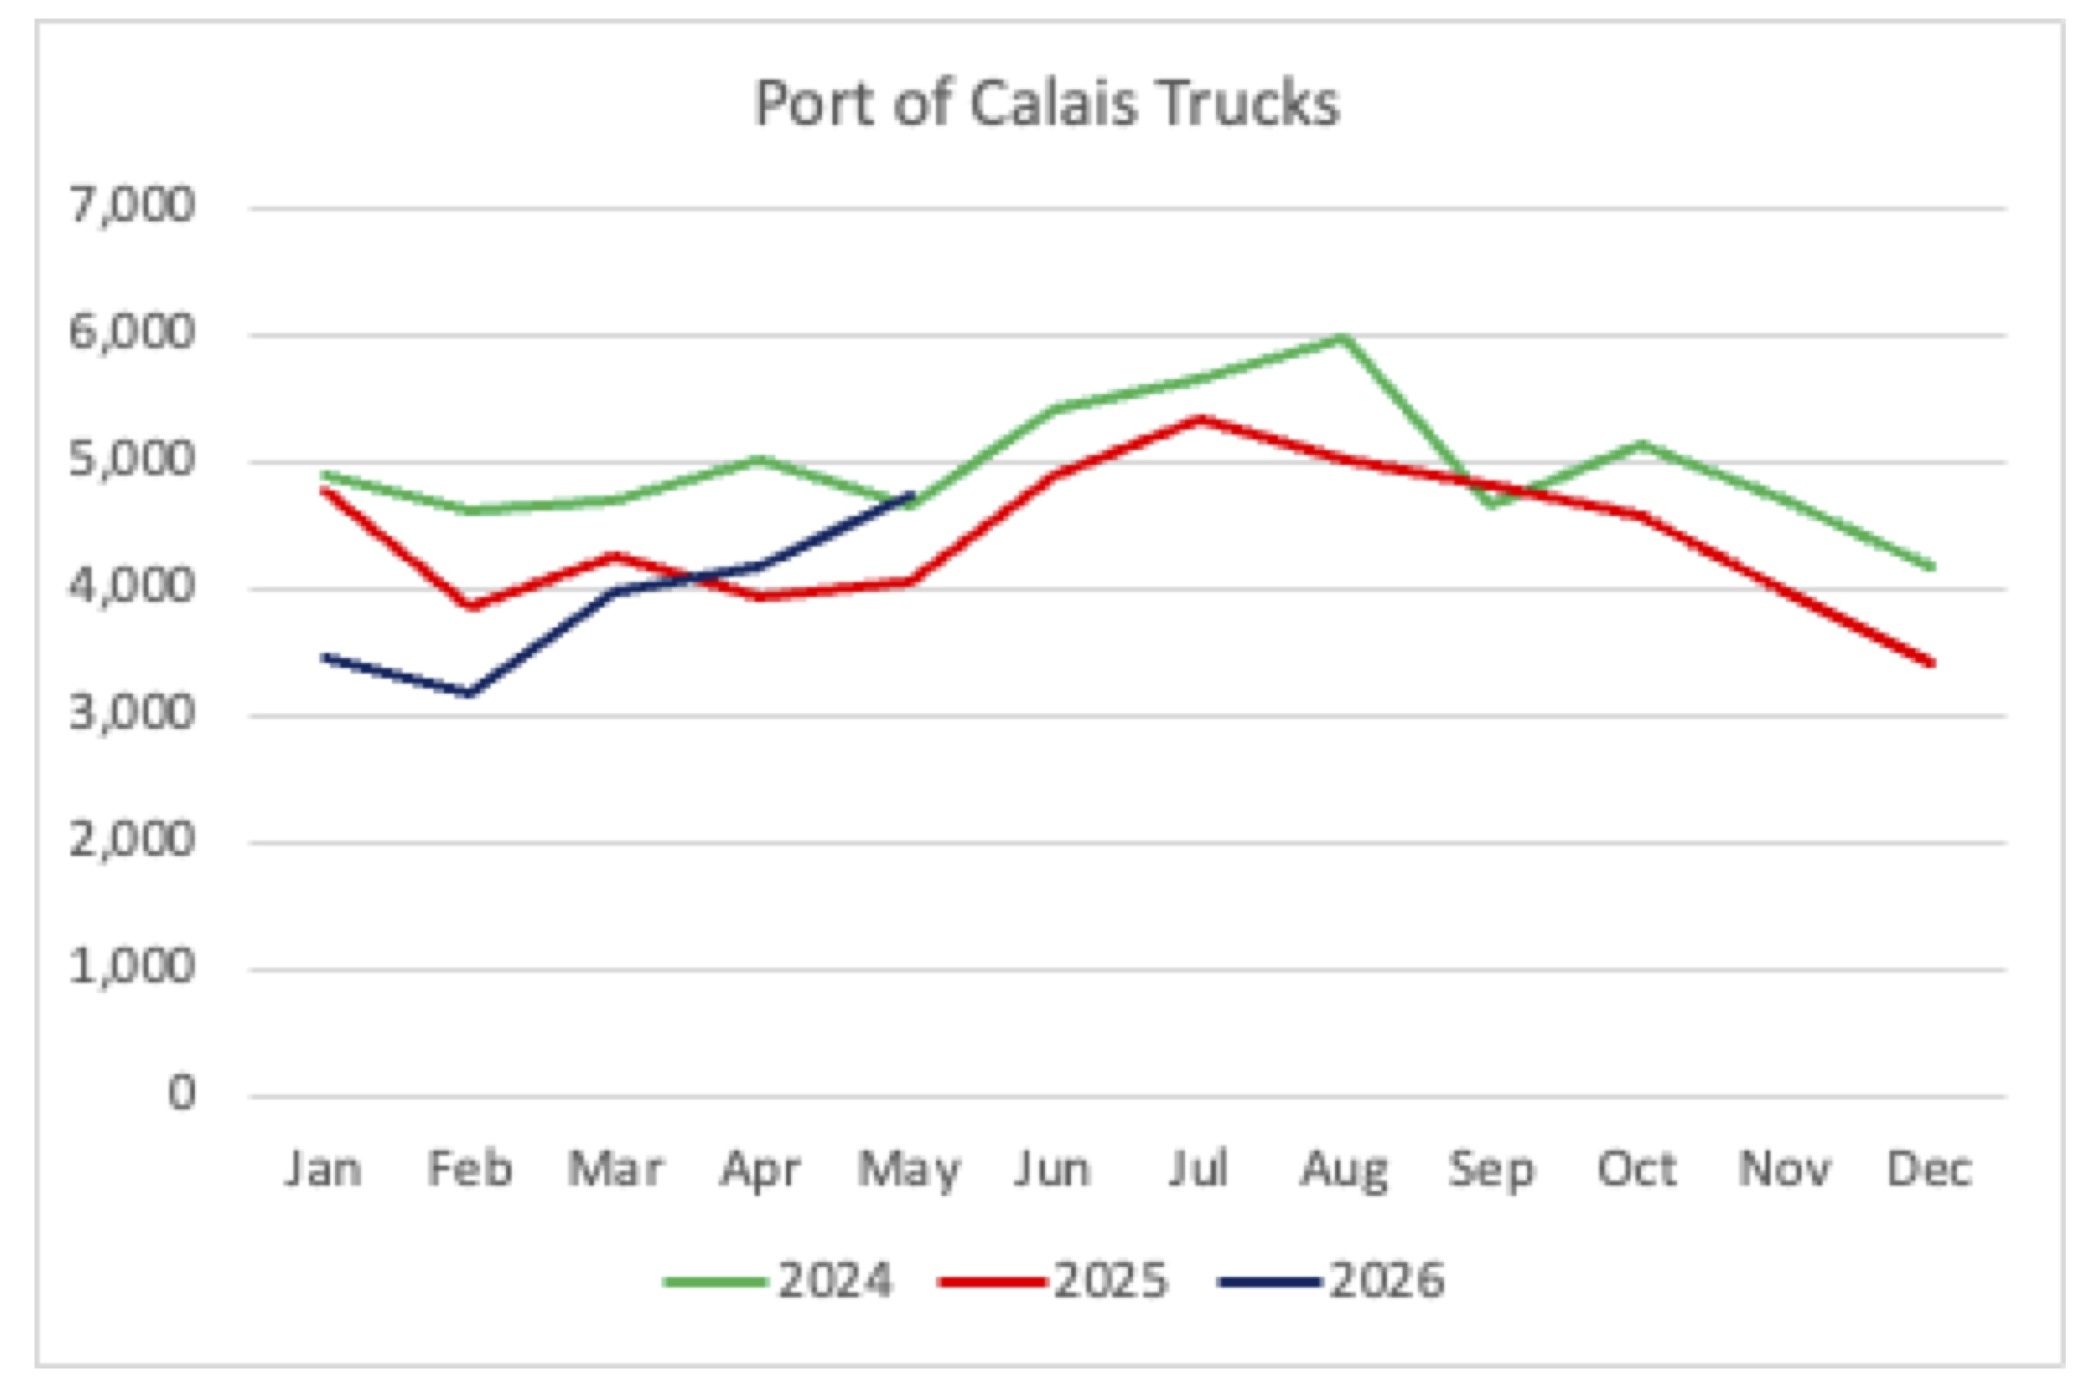
Port of Calais Trucks (2024-2026)
The impact on the restaurants, hotels, gas stations, and stores in greater Calais is less clear, but improved from the significant decreases in taxable sales seen last year. There were just over $10.5 million in taxable retail sales in April 2026 in the greater Calais area. When adjusted for inflation, this represented a 4% gain over the same month in 2025.
Although year-over-year results in January were essentially flat, February 2026 showed a roughly 6% gain year-over-year, while March 2026 showed a 6% loss relative to March 2025. These mixed results are a significant improvement over last year when double-digit decreases in inflation-adjusted taxable retail sales in greater Calais were common. Hopefully, this indicates a stabilization of cross-border traffic and sales.
SCEC is working with federal, state, and Canadian partners to convene a summit in the fall to discuss border and trade issues and their impact on Washington County’s economy. With the transition to annual review of the United States-Mexico-Canada Agreement and the recent shifts in cross-border crossings and trade, it will be helpful to focus discussion on the local economic impacts of these larger trends. We expect to send out a save-the-date in early August.
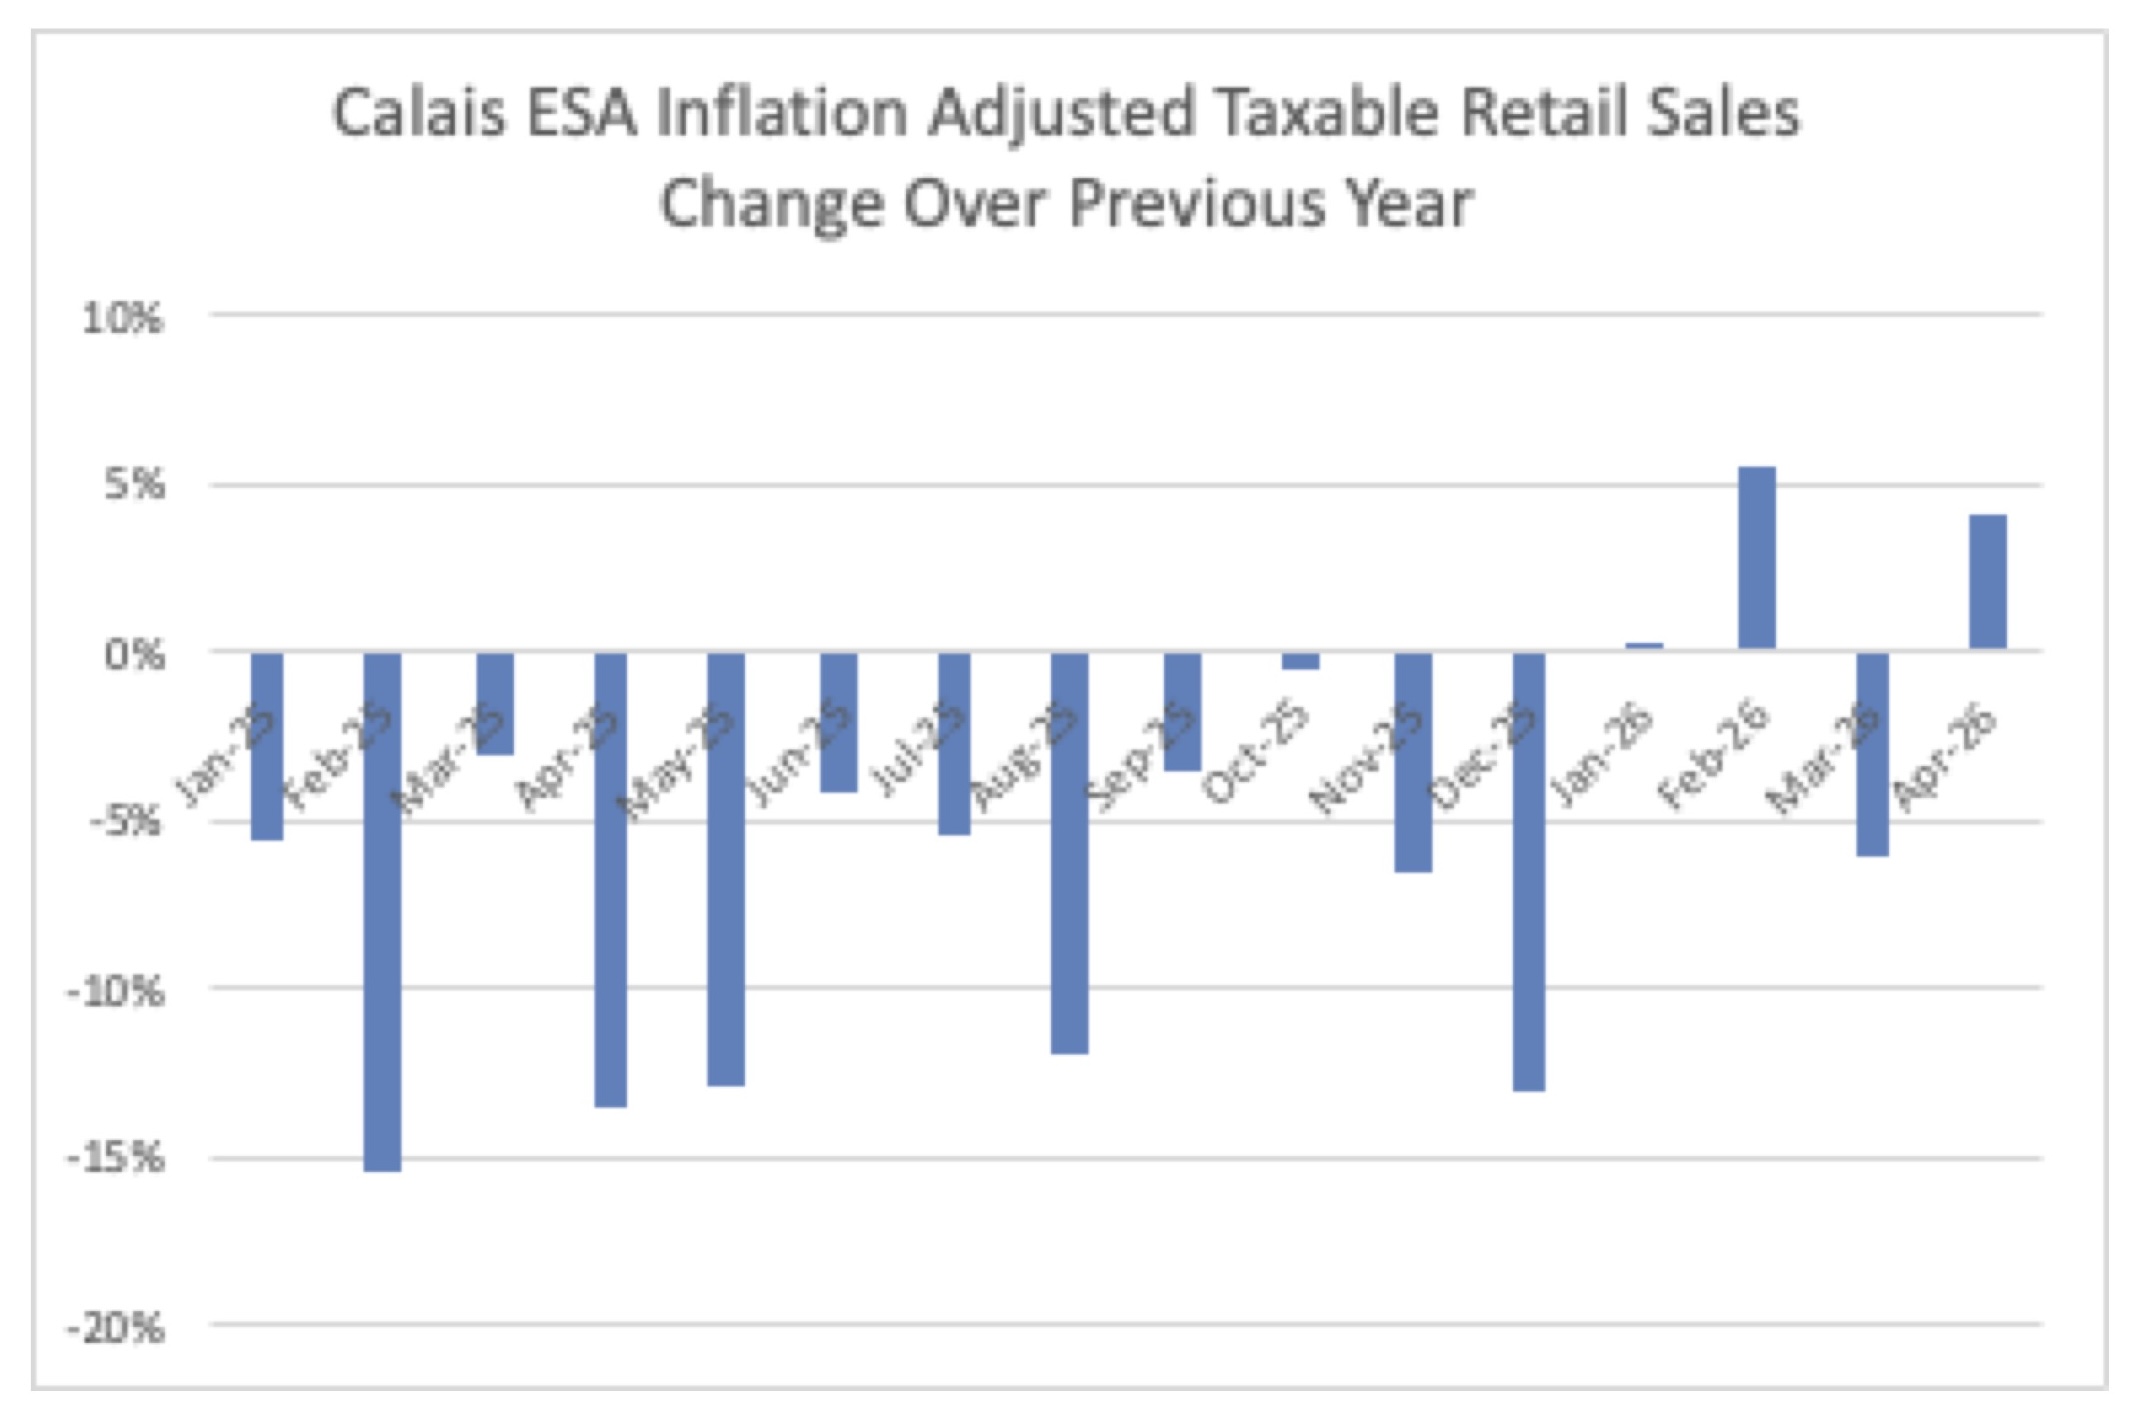
Calais ESA Inflation Adjusted Taxable Retail Sales Change over Previous Year
Cover photo by Paulo O from Halifax, Canada, CC BY 2.0 via Wikimedia Commons